People
Guido Reina
Steffen Frey (Co-Investigator)
Thomas Ertl (Retired)
Moritz Heinemann
Alexander Straub (Alumnus)
Stefan Scheller (Alumnus)
Steffen Frey (University of Groningen, Bernoulli Institute, Scientific Visualization and Computer Graphics)
Publications
Preprints
- Gadirov, H., Roerdink, J. B. T. M., & Frey, S. (2025). FLINT: Learning-based Flow Estimation and Temporal Interpolation for Scientific Ensemble Visualization. In arXiv preprint arXiv:2409.19178. https://doi.org/10.48550/arXiv.2409.19178
Conference Papers
- Straub, A., Boblest, S., Karch, G. K., Sadlo, F., & Ertl, T. (2022). Droplet-Local Line Integration for Multiphase Flow. 2022 IEEE Visualization and Visual Analytics (VIS), 135–139. https://doi.org/10.1109/VIS54862.2022.00036
Journal Articles
- Straub, A., Karadimitriou, N., Reina, G., Frey, S., Steeb, H., & Ertl, T. (2024). Visual Analysis of Displacement Processes in Porous Media using Spatio-Temporal Flow Graphs. IEEE Transactions on Visualization and Computer Graphics, 30, Article 1. https://doi.org/10.1109/TVCG.2023.3326931
- Straub, A., Sadlo, F., & Ertl, T. (2024). Feature-based deformation for flow visualization. Journal of Visualization, 27, 795–817. https://doi.org/10.1007/s12650-024-00963-5
- Bauer, R., Ngo, Q. Q., Reina, G., Frey, S., Flemisch, B., Hauser, H., Ertl, T., & Sedlmair, M. (2023). Visual Ensemble Analysis of Fluid Flow in Porous Media Across Simulation Codes and Experiment. Transport in Porous Media, 151. https://doi.org/10.1007/s11242-023-02019-y
- Frey, S. (2022). Optimizing Grid Layouts for Level-of-Detail Exploration of Large Data Collections. Computer Graphics Forum, 41, 247–258. https://doi.org/10.1111/cgf.14537
- Frey, S., Scheller, S., Karadimitriou, N., Lee, D., Reina, G., Steeb, H., & Ertl, T. (2021). Visual Analysis of Two-Phase Flow Displacement Processes in Porous Media. Computer Graphics Forum, 41, 243–256. https://doi.org/10.1111/cgf.14432
- de Winter, D. A. M., Weishaupt, K., Scheller, S., Frey, S., Raoof, A., Hassanizadeh, S. M., & Helmig, R. (2020). The Complexity of Porous Media Flow Characterized in a Microfluidic Model Based on Confocal Laser Scanning Microscopy and Micro-PIV. Transport in Porous Media, 136, 343–367. https://doi.org/10.1007/s11242-020-01515-9
- Frey, S. (2020). Temporally Dense Exploration of Moving and Deforming Shapes. Computer Graphics Forum, 40, 7–21. https://doi.org/10.1111/cgf.14092
- Frey, S. (2018). Spatio-Temporal Contours from Deep Volume Raycasting. Computer Graphics Forum, 37, 513–524. https://doi.org/10.1111/cgf.13438
- Gralka, P., Grottel, S., Staib, J., Schatz, K., Karch, G. K., Hirschler, M., Krone, M., Reina, G., Gumhold, S., & Ertl, T. (2018). 2016 IEEE Scientific Visualization Contest Winner: Visual and Structural Analysis of Point-based Simulation Ensembles. IEEE Computer Graphics and Applications, 38, 106–117. https://doi.org/10.1109/MCG.2017.3301120
- Zhang, H., Frey, S., Steeb, H., Uribe, D., Ertl, T., & Wang, W. (2018). Visualization of Bubble Formation in Porous Media. IEEE Transactions on Visualization and Computer Graphics, 25, 1060–1069. https://doi.org/10.1109/TVCG.2018.2864506
- Frey, S., & Ertl, T. (2017). Flow-Based Temporal Selection for Interactive Volume Visualization. Computer Graphics Forum, 36, 153–165. https://doi.org/10.1111/cgf.13070
Published data sets
- Karadimitriou, N., Lee, D., & Steeb, H. (2023). Visual characterization of displacement processes in porous media [DaRUS]. https://doi.org/10.18419/DARUS-3615
Research
About this Project
The long-term goal of this project is to develop visualization techniques for the interactive investigation of phenomena that occur in and around porous media, with a particular focus on effects in the vicinity of interfaces. This requires automated approaches that extract features at multiple granularity levels and allow for comparing these features across time, ensemble dataset members, and spatial scales. We aim for integration with interactive exploration of both the spatiotemporal data and the available metrics and the occurrences and frequencies of the detected features in a way that scales with ensemble size.
Results
Funding Period 1
We introduced advanced visualization tools to analyze complex scientific data, focusing on fluid dynamics, porous media, and parameter space exploration. We developed a free, open-source volume renderer for visualizing 3D scalar data, which has been successfully applied to fluid-fluid and fluid-solid interfaces. To analyze time-dependent processes, we introduced spatio-temporal contour visualizations that aggregate dynamic fields, enabling efficient exploration of processes such as droplet collisions and laser pulse experiments. Additionally, we created an automated technique for bubble extraction and comparative visualization, allowing us to study bubble formation in porous rock formations by classifying and clustering bubbles based on morphology and geometric features. For flow analysis, we utilized stream surfaces to investigate transport mechanisms and flow boundaries in microfluidic structures, comparing experimental and simulated behaviors. We also developed novel methods for abstract visualization and parameter space exploration. We used node-link diagrams for two-phase flow displacement experiments to aggregate temporal data and relate fluid propagation to pore-space characteristics. High-dimensional parameter spaces were explored using clustering and dimensionality reduction techniques, enabling insights into simulation results through coordinated visualizations such as scatter plots and parallel coordinate plots. To address the challenges of large-scale data, we implemented high-performance visualization approaches, including an interactive geothermal energy demonstrator that dynamically evaluates models on GPUs, allowing real-time exploration of underground heat transport. These tools collectively advance our ability to understand and analyze complex physical processes through innovative and scalable visualization techniques.
Funding Period 2
Ensemble exploration
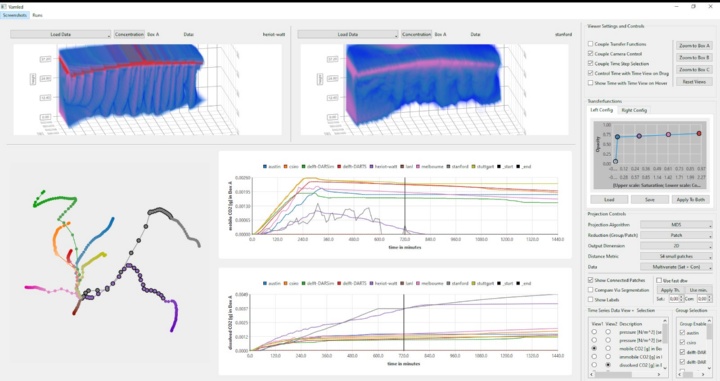
In cooperation with SimTech and project D03, we implemented an interactive approach for the analysis of the FluidFlower benchmark study. It facilitates the comparison of the temporal evolution of the available nine simulations in an abstract similarity space together with the respective changes in CO2 concentration metrics and a direct visualization that quickly conveys the temporal evolution of the spatial distribution of CO2, showing the progression of effects like fingering.

Parameter sensitivity exploration
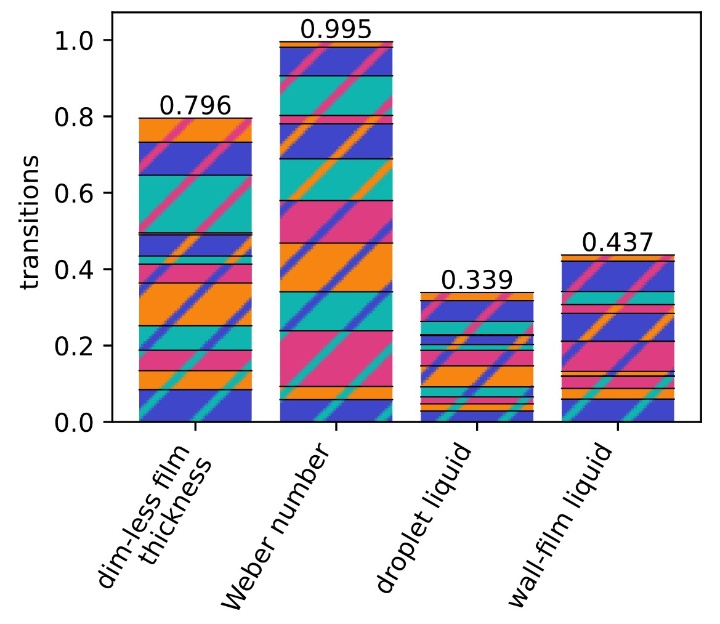
We proposed a model to quantify the sensitivity of ensembles to parameter changes. Given an ensemble labeled or clustered to group similar behavior, we construct a Voronoi decomposition of the high-dimensional parameter space and model the sensitivity as the flux across Voronoi faces, i.e., the transition interfaces between regions of homogeneous results. This model allows us to quantify the sensitivity with respect to each parameter based on the projections of these interfaces onto each parameter axis. These sensitivities are then summarized into charts for analysis.

Spatiotemporal abstraction of two-phase flow
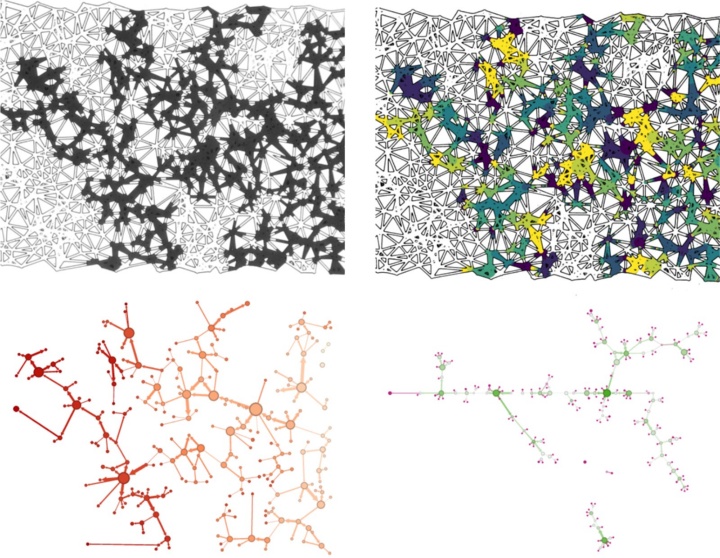
We introduced an abstraction for the progression of an invading fluid in two-phase microfluidics together with projects B05 and Z02. This time map lets one quickly distinguish regions of especially slow or fast fluid progression, highlighting Haines jumps. We further abstracted this progression into a simplified flow graph to highlight only topological changes. This graph can be used as a fingerprint for ensemble members, showing the amount and complexity of the fluid fingers, and it can be annotated with further metrics.

Estimation of flow fields
We developed FLINT (learning-based FLow estimation and temporal INTerpolation) to estimate flow features for 2D+time and 3D+time scientific data, either when the flow information is unavailable or to enhance its temporal resolution. FLINT’s modular loss function allows it to cater to different use cases. The concept could also serve as a predictor to enable dataset compression. We developed this approach into HyperFLINT by including hypernetworks that consider available simulation parameters and steer the FLINT network accordingly.
Hierarchical ensemble exploration
We proposed two complementary approaches for the exploration of large ensembles. The first one (LDG) starts with all ensemble members and generates level-of-detail grids by consecutively aggregating them into 2x2 groups and replacing these with a single representation with highlighted uncertainty. The approach scales to a million ensemble members, surpassing known approaches by orders of magnitude. Among others, we apply the approach to analyze channel structures in soil with project B04 (see Figure). The second approach (Sca2Gri) generates the 2D embeddings from extracted features. It is even faster but only works on a sampling of the whole dataset.
Future Work
We will continue improving the generation and navigation of our hierarchical grid-based abstraction of simulation ensembles and investigate data-driven glyph representations. We will further investigate visualizations across multiple spatial scales that transport features beyond the current exploration context while reflecting the scale of origin. Finally, we want to facilitate long-running or high-throughput data collection by providing novel edge visualization methods.
We plan to collaborate with project A03 to develop visualization techniques for multi-scale models of coupled free-flow and porous-medium systems in laminar flow regimes at the macroscopic (REV) scale. This work focuses on validating models and analyzing parameter spaces, with plans to integrate our visualization approach into the preCICE framework for broader applicability and collaboration toward the vision topic. With project D02, which also employs similarity metrics for eliminating simulation redundancies, we aim to improve our comparative metrics to enhance visual analysis.
Our ensemble analysis approach targets three specific application scenarios. First, in cooperation with Maartje Boon, we plan to analyze gas ganglia structures across experiments using feature extraction, hierarchical visualizations, and abstract representations to classify and compare geometries and behaviors over time. Second, we collaborate with project D03 to analyze benchmark ensemble data, addressing challenges in feature extraction for slow, small-scale processes like salt precipitation. Third, we work with projects B05 and Z02 to investigate thin fracture networks spanning large domains, requiring expressive feature extraction and fine-grained change detection for real-time processing and data reduction. Additionally, project B04 provides a use case for hierarchical ensemble exploration in studying flow and transport changes due to clogging in fractured-porous media. We also collaborate with project INF to ensure sustainable research software development and to integrate standardized experiment metadata into our visualizations.
International Cooperation
University of Bergen, Norway
We collaborate with Prof. Helwig Hauser at the University of Bergen to analyze simulation ensembles, e.g., the FluidFlower Benchmark dataset.
University of California in Davis, USA
We work with Prof. Kwan-Liu Ma's group on hypernetworks that consider available simulation parameters in our neural networks for flow extraction and temporal interpolation.
King Abdullah University of Science and Technology, Saudi Arabia
We collaborate with Prof. Markus Hadwiger's group at KAUST to analyze large-scale and high-volume data and investigate modern technologies for visualization deployment on the web.
For further information please contact

Guido Reina
Dr.Project Leader, Research Project D01, Project INF

Steffen Frey
Dr. rer. nat.Co Project Leader, Research Project D01


